Offer acceptance rate: why candidates say yes, then go somewhere else
Your offer acceptance rate tells you how often candidates say yes. Your own database tells you where they went instead. Oxxi connects the two.
Your offer acceptance rate tells you how often candidates say yes. Your own database tells you where they went instead. Oxxi connects the two.
Every agency recruiter has lost a candidate at the offer stage. What stings is not the loss. It is finding out three weeks later, from the candidate's own profile update, which company took them. That information was almost never new. It was sitting in your database the whole time.
What is offer acceptance rate?
Offer acceptance rate is the share of offers extended that candidates accept, over a defined period. Divide accepted offers by total offers made.
It is the last metric in the funnel and the most expensive one to get wrong. Everything before it is already paid for: the sourcing hours, the screening, the interview loops, the salary negotiation. A declined offer writes all of it off.
Here are the documented numbers, each with its source.
78% average offer acceptance rate between 2021 and 2024, measured by Ashby across 230,000 applications. Technical roles 73%, business roles 84%.
50% of candidates accepted an offer and then backed out before their start date, in a Gartner survey of roughly 3,500 candidates, May 2023.
47% were still open to other offers after accepting one, and 35% had received four or more offers. Same Gartner survey.
Cost per hire of $5,475 for non-executive roles and $35,879 for executive roles, SHRM 2025 benchmarking, 2,371 respondents.
Read the Ashby numbers as a measurement and the Gartner numbers as survey self-report. They are different kinds of evidence and they point the same way. None of them are Gulf-specific: no published dataset gives offer acceptance rates for Kuwait or the wider region, so treat these as international benchmarks rather than local measurements.
Half of candidates accept, then back out
The Gartner figure is the one worth sitting with. Half of candidates surveyed had accepted an offer in the previous twelve months and then withdrawn before their start date. Forty-seven percent said they were still entertaining other offers after they had accepted one.
So an acceptance is not a close. It is a position in a race that is still running, and you are usually the only party who thinks it has finished.
The counter-offer statistic you have seen is not real
You have read that 80% of people who accept a counter-offer leave within six months. Or 89%. Or two-thirds. Or 48% within a year. The number changes every time it is repeated, which is the tell.
Nobody can produce a primary source for it. Tracing the citations leads to an untraceable Wall Street Journal article or to a "National Employment Association" with no findable website. We are not going to repeat it here, because a made-up benchmark is worse than no benchmark: it anchors your negotiation to a number nobody can stand behind.
What is documented is the Gartner finding above. Use that one.
The information was already in your database
Here is the part agencies underrate. When a candidate goes somewhere else, the company that took them is almost never a stranger to your records.
The same employers keep appearing. As the place a candidate came from. As the place a previous candidate moved to. As the place three people you interviewed last year are sitting right now. Years of that history, already paid for, sitting in rows that never got connected to each other.
A standard database stores those facts as separate records: a candidate row, a company row, an interview row. Nothing joins them, so nothing can be asked of them.
What is a talent graph?
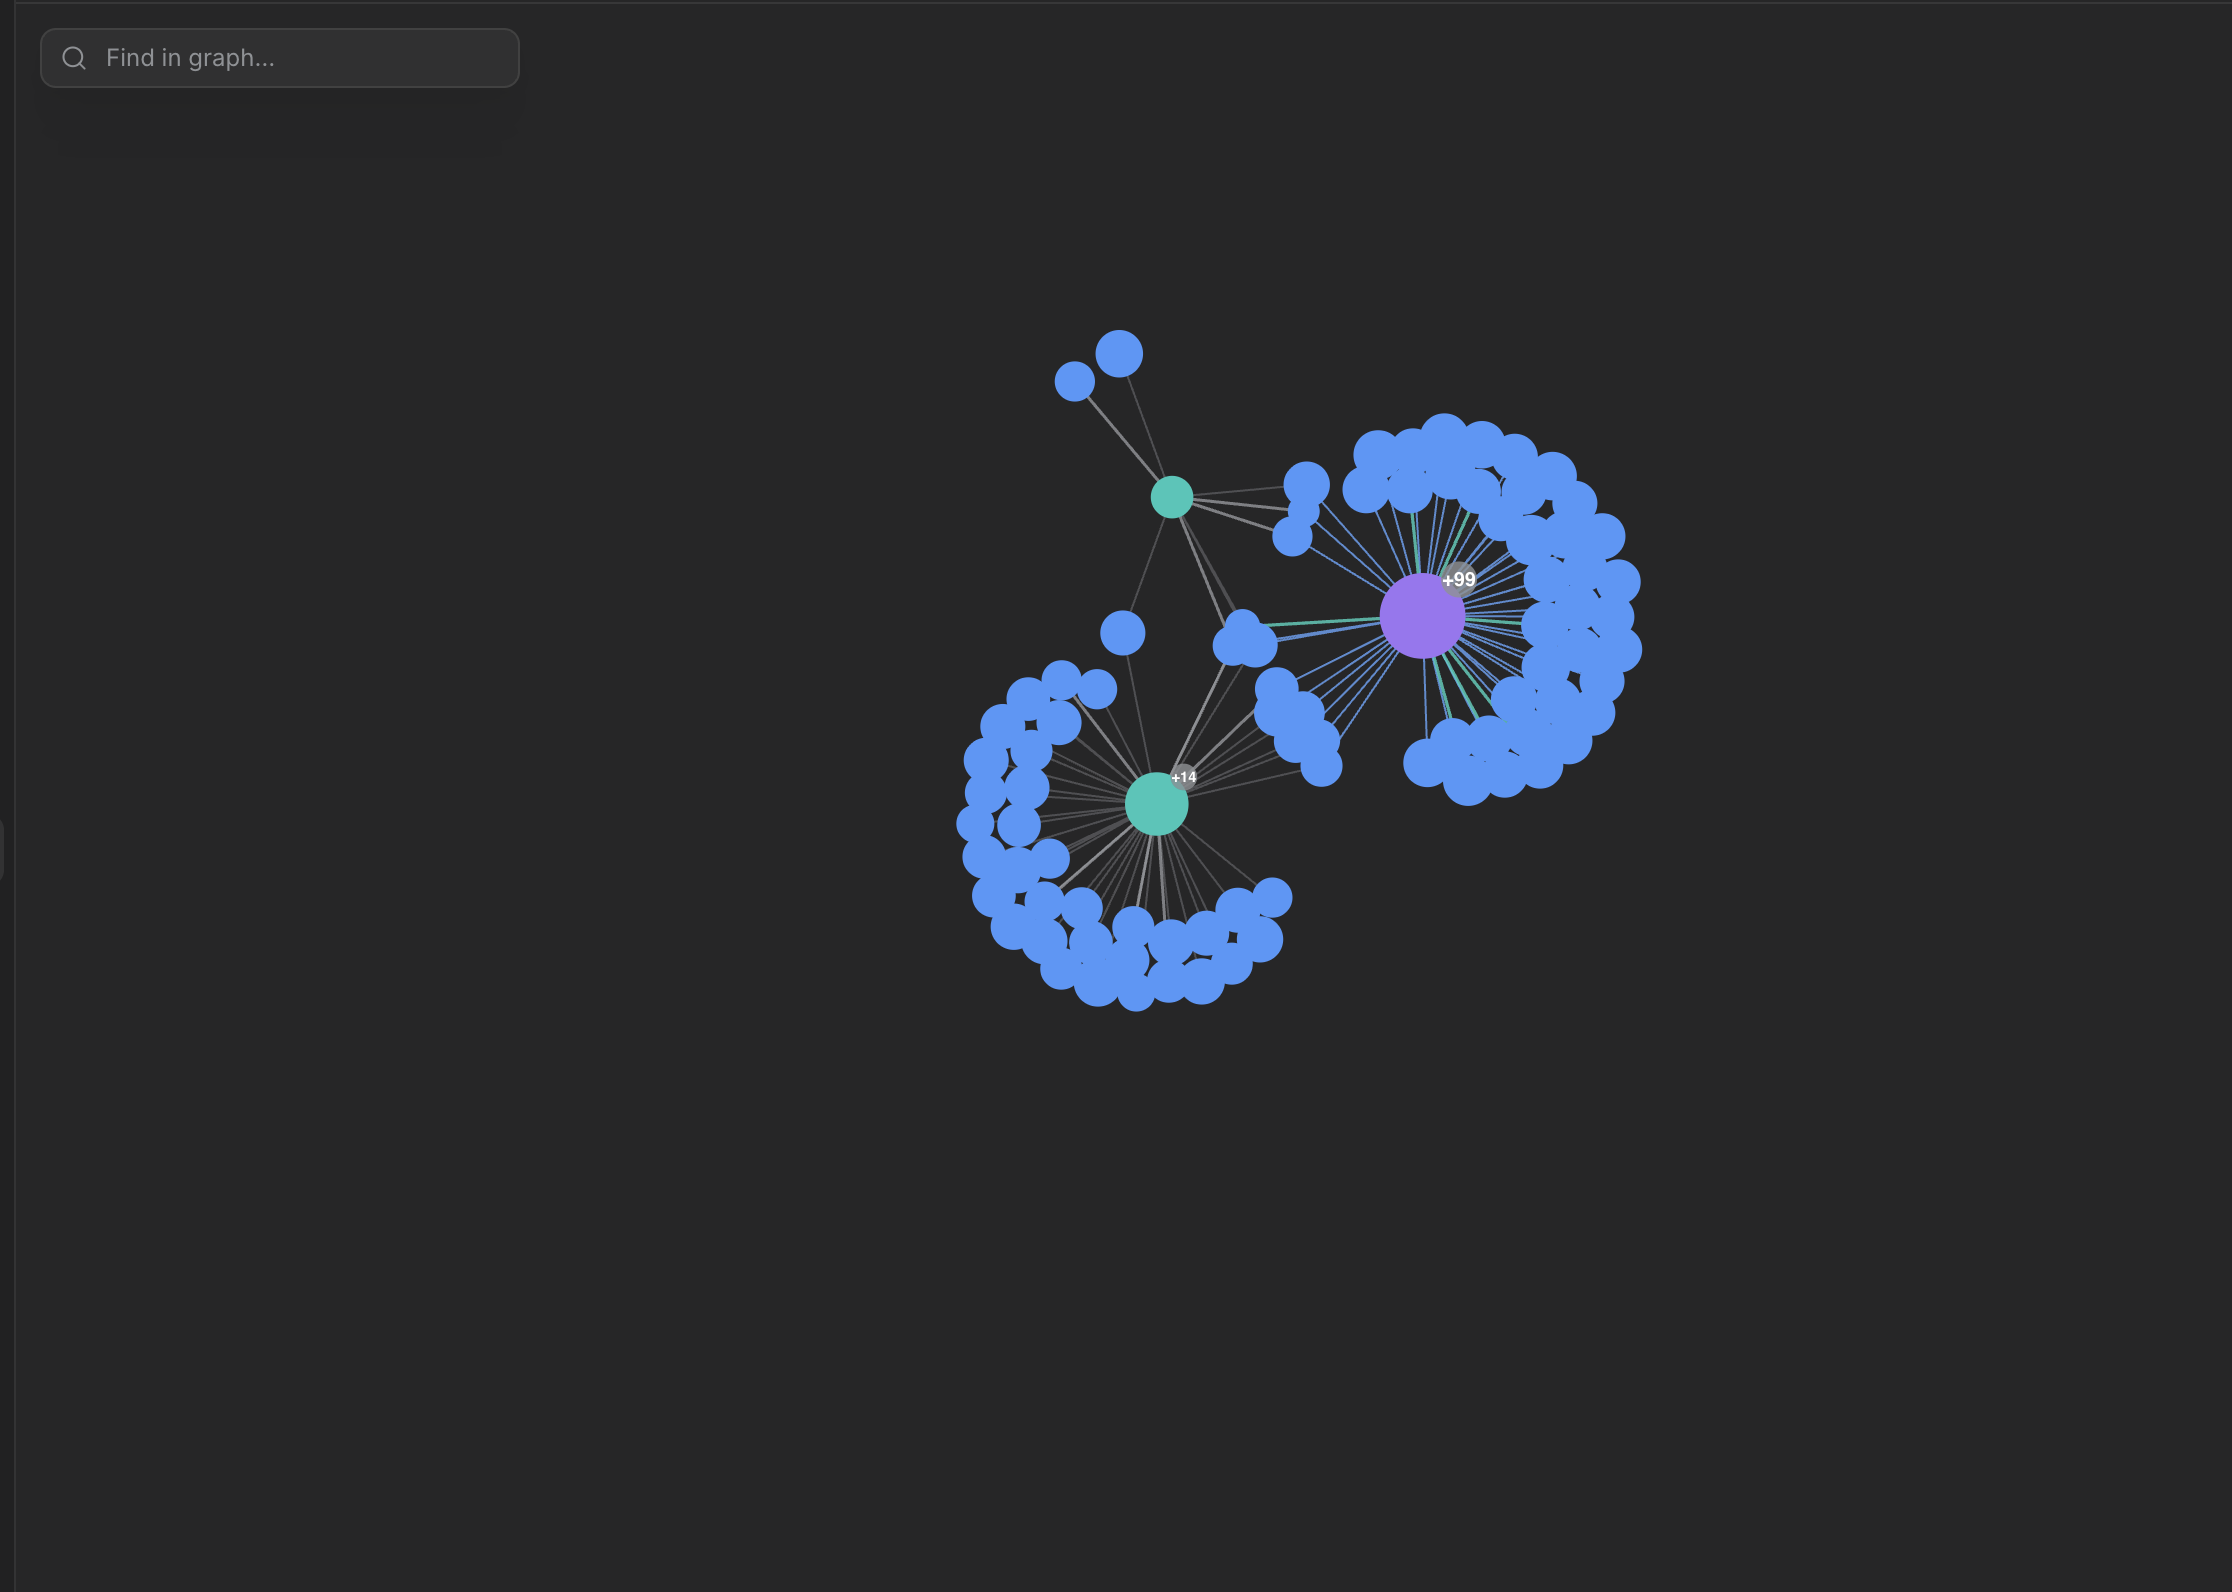
A talent graph is your hiring history stored as connections rather than rows, so the companies, candidates, interviews and decisions in your records point at each other and can be read as one map. In Oxxi that map is built from your own hiring as you work.
The difference is not storage, it is what you can ask. A list answers "who did we interview". A graph answers "which employers keep taking the people we shortlist, and how many of ours are sitting there today".
The column that matters
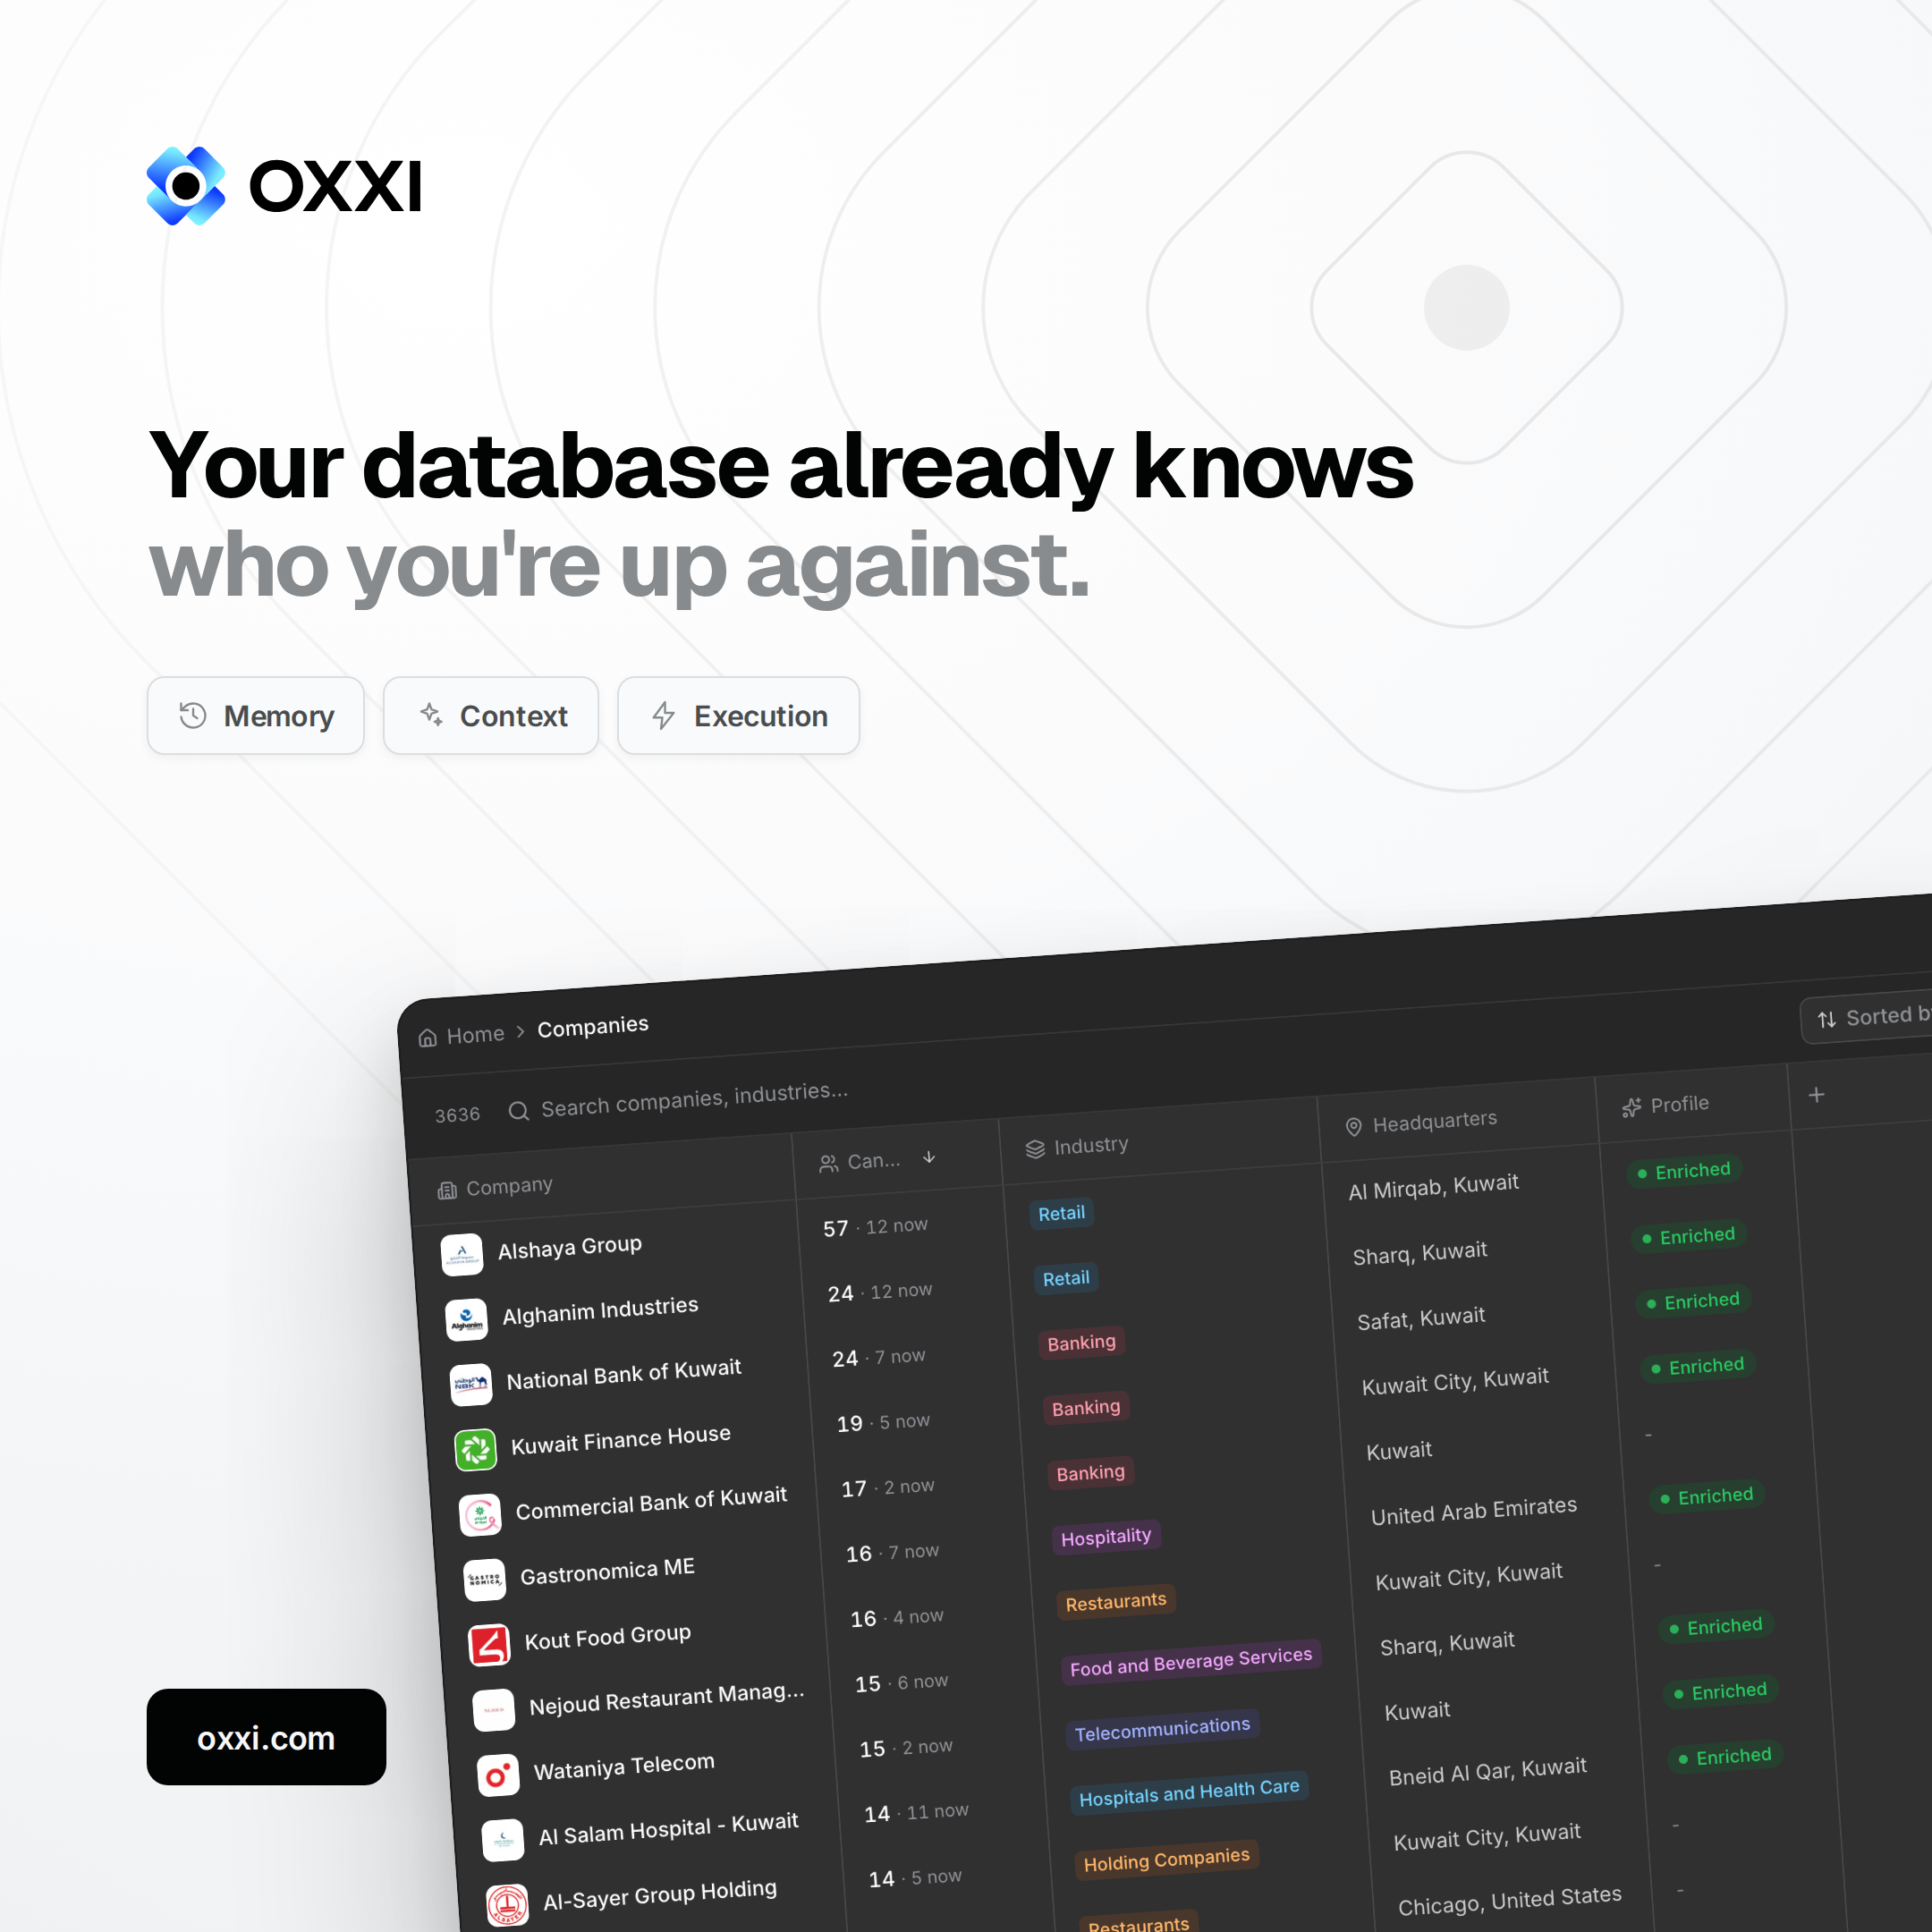
Look at the second column: 57 · 12 now. Fifty-seven of your candidates have passed through Alshaya Group. Twelve of them work there today.
That is the whole argument in one cell. The first number is your history with an employer. The second number is your present exposure to them. Sorted by candidate count across 3,636 companies, it is a ranked list of who you are actually competing with, built from nothing but the records you already own.
You did not buy that data. You generated it, one placement at a time, and until now it was unreadable.
What this changes in the workflow
When the companies are in the workspace rather than in a spreadsheet, the agent working a role carries them into the work.
Sourcing starts knowing which employers your shortlist tends to come from. Salary benchmarking runs against the companies that actually compete for this profile rather than a national average. And when a candidate is at offer stage, the question "who else is likely in this" has an answer drawn from your own history instead of a guess.
Every past decision in the graph is a pattern the agent follows. Reject a profile for a reason once, and that reason is available the next time a similar profile appears.
An AI-native recruitment agency, and headhunting when you need it
We built this for our own desk first. Oxxi is AI-native hiring infrastructure based in Kuwait, and we run an AI-native recruitment agency on top of it, using the same platform we sell and the same talent graph.
So there are two ways to use us. Run the search yourself inside Oxxi, or hand the role to our team: executive search and direct headhunting for the roles where the right person is not applying, from senior leadership to scarce technical profiles, across Kuwait and the Gulf.
The difference from a traditional recruitment agency is that the map stays with you. A traditional agency takes its knowledge of your market with it when the role is filled. Here the record stays in your workspace, and the next role starts from it.
What Oxxi does not do
Worth stating plainly, because the category is full of claims that do not survive contact with a demo.
Oxxi does not alert you to a live competing offer. No system can see inside another company's hiring process. What it shows is which employers your candidates have historically moved to and which ones they sit in now, which is a probability, not a notification.
Oxxi does not read your email.
Hiring is not automated end to end, and anyone selling that is overselling. Automation in Oxxi covers sourcing, shortlisting, salary benchmarking, job distribution and scheduling. The judgement stays with your recruiters.
Questions we get asked
What is a good offer acceptance rate?
Ashby measured an average of 78% across 230,000 applications between 2021 and 2024, with technical roles at 73% and business roles at 84%. Compare yourself to your own trend before comparing to a benchmark, because role mix moves the number more than performance does. Oxxi tracks acceptance against the companies your candidates actually go to.
Why do candidates accept an offer and then back out?
Because the search does not stop when they accept. Gartner surveyed roughly 3,500 candidates in May 2023 and found 50% had accepted an offer and withdrawn before starting, with 47% still open to other offers after accepting. Oxxi shows which employers in your own database those candidates historically move to.
How do I find out which companies I am competing with for candidates?
Look at your own placement history rather than buying market data. Oxxi builds a talent graph from your records and sorts every company by how many of your candidates passed through it and how many work there today.
What is a talent graph in recruitment?
A talent graph is your hiring history stored as connections rather than rows, so companies, candidates, interviews and decisions point at each other and can be read as one map. Oxxi builds one from your own hiring as you work, which is what lets an agent reason over your history instead of searching text.
Is Oxxi a recruitment agency or software?
Both, in that order. Oxxi is AI-native hiring infrastructure first, and we run an AI-native recruitment agency on it from Kuwait. You can run the search yourself on the platform, or hand the role to our team and we will run it for you.
Do you offer headhunting or executive search?
Yes. Oxxi takes on executive search and direct headhunting for roles where the right person is not applying, across Kuwait and the Gulf. We run it on the same platform, so the talent graph and every decision made during the search stay in your workspace once the role is filled.
Is the statistic that 80% of counter-offer acceptors leave within six months true?
No. It circulates as 48%, two-thirds, 80% and 89% depending on the source, and no primary study can be traced behind any version. Use the documented Gartner finding instead: 50% of candidates accepted an offer and backed out before starting within a twelve-month period.
Can software tell me if my candidate has another offer?
No, and be sceptical of anything that claims it. Oxxi does not see inside another company's hiring process and does not read your email. It shows which employers your candidates have moved to before and which ones they are in today, which is a pattern rather than an alert.
What does it cost to lose a candidate at the offer stage?
SHRM's 2025 benchmarking, from 2,371 respondents, puts cost per hire at $5,475 for non-executive roles and $35,879 for executive roles. A declined offer does not recover that spend, it repeats it. Oxxi is built to make the second attempt start from what the first one learned.
How do I get more value out of my existing recruitment database?
Connect it rather than search it. Most agency databases hold years of companies, candidates and decisions as separate records that cannot be asked a question. Oxxi turns that history into a talent graph, which is what makes candidate rediscovery a query rather than a project.
Start with the companies you already have
Your database has been recording who you compete with for as long as you have been placing people. It just never presented it back to you. Open the Companies view in Oxxi, sort by candidate count, and read the second column. And if the role is one nobody applies to, leave the headhunting to us.
See how the graph is built in the AI second brain for recruiters.
Sources
Ashby, Talent Trends Report, offer acceptance rates, measured across 230,000 applications from January 2021 to March 2024: ashbyhq.com
Gartner HR survey of approximately 3,500 candidates, May 2023: gartner.com
SHRM 2025 Benchmarking Reports, cost per hire, survey of 2,371 members between 9 January and 3 March 2025: shrm.org
On the unsourced counter-offer statistic: The Interview Guys
Oxxi Team
The Oxxi editorial team - building AI-native hiring for the GCC & MENA.